
Learn how automated XAUUSD gold trading works in the UAE: spreads, rollover, leverage, news filters and risk limits explained with a worked example.
How to Master Automated Trading Position Sizing and Protect Your Account.
Most traders spend their time on entries and exits. Experienced traders know that automated trading position sizing often matters just as much. It decides how much of your account each trade puts at work, and that single number shapes how smooth or bumpy your results feel over time.
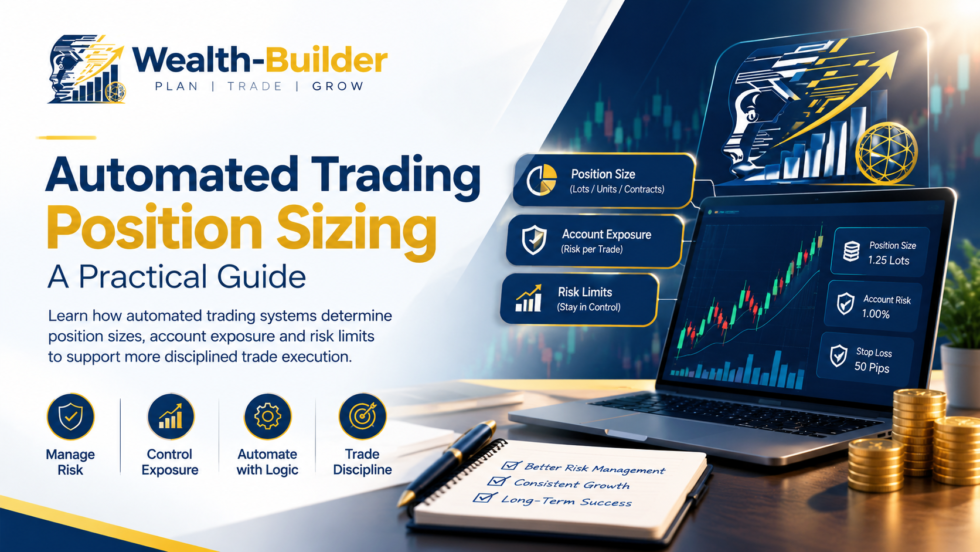
The encouraging part is that position sizing is a process you can understand and measure. This guide explains how automated systems determine position sizes, how they manage account exposure, and which risk limits support disciplined execution. A worked example with real numbers shows how it all fits together.
Quick Answer: What Is Automated Trading Position Sizing?
| Key Takeaways Position sizing is the coded rule that decides how large each trade is. Leverage sets the upper limit, and sizing decides how much of it you actually use. The most widely used method is fixed percentage risk, commonly 0.5% to 2% of the account per trade, with the size worked out from the stop-loss distance. In our worked example, risking 1% of a $10,000 account on a 30-pip EUR/USD stop gives a position of about 0.33 lots, while a fixed 1.00 lot risks three times as much. Combine sizing with total open risk caps, correlation checks, daily loss limits and drawdown circuit breakers. |
What Is Position Sizing in Automated Trading?
Position sizing is the rule that decides how large each trade should be. In an automated system, the rule is coded in advance, so every trade is sized the same logical way, whether the market is calm or busy and whether the last trade won or lost.
Position Size vs. Lot Size vs. Leverage
These terms are related but different. Position size is the amount you trade, usually measured in lots, units or contracts. Leverage is the borrowing power your broker provides, which allows larger positions for the same margin. Leverage sets the upper limit of what you can open, while position sizing decides what you should open. Good systems use sizing to stay well below that limit.
Why Position Sizing Matters as Much as Entry Signals
Even a strong strategy can struggle if each trade is too large, because a normal run of losses then becomes a deep drawdown. A modest strategy with sensible sizing can stay in the game long enough for its edge to show. Sizing is how a system turns a trading idea into controlled, repeatable risk.
How Automated Systems Determine Position Size
There are four common approaches, from the simplest to the most statistical.
Fixed Lot or Fixed Unit Sizing
The system trades the same size every time, such as 0.10 lots. It is easy to understand, but the money at risk changes with the stop-loss distance, and the size does not grow or shrink with the account.
Fixed Percentage Risk (Fixed Fractional)
This is the most widely used approach. The system risks a set percentage of the account on each trade, commonly 0.5% to 2%, and works out the size from the stop-loss distance. As the account grows the size rises, and after losses it shrinks, which automatically protects capital.
Volatility-Based Sizing
Here the stop distance comes from market volatility, often measured by the Average True Range (ATR). [1] When markets move more, the stop is wider and the position is smaller, so the money at risk stays steady across different conditions.
Kelly Criterion and Fractional Kelly
The Kelly formula estimates the optimal fraction to risk from a strategy's win rate and its average win-to-loss ratio. [2] For example, a 55% win rate with a 1.5 reward-to-risk ratio gives a full Kelly figure of 25% (0.55 minus 0.45 divided by 1.5). That is far too aggressive for most people, and the inputs are only estimates, so practitioners usually apply a small fraction of Kelly, if they use it at all. [3]
| Method | How it works | Strengths | Watch out for |
| Fixed size | Every trade uses the same lots or units | Simple and predictable | Risk changes with every stop distance and ignores account growth |
| Fixed percentage risk | Risks a set share of the account, such as 1%, using the stop distance | Scales with the account and keeps risk consistent | Needs a clear stop-loss on every trade |
| Volatility-based | Sets stop distance from market volatility (for example ATR), then sizes to fit | Adapts to quiet and fast markets | Smaller sizes in volatile markets can feel cautious |
| Fractional Kelly | Uses win rate and reward-to-risk to estimate an optimal fraction, then scales it down | Grounded in the strategy's own statistics | Sensitive to inaccurate inputs; full Kelly is aggressive |
A Step-by-Step Position Sizing Example
Here is the fixed percentage method with real numbers. This is an illustration, not a recommendation.
The Formula
Position size = (Account balance x risk %) / (stop distance x value per pip per lot)
The Numbers
- Account balance: $10,000
- Risk per trade: 1%, which equals $100
- Instrument: EUR/USD, where one standard lot is worth about $10 per pip on a USD account
- Entry 1.0850, stop-loss 1.0820, so the stop distance is 30 pips
Risk per lot is 30 pips x $10 = $300. Position size is $100 / $300 = 0.33 lots. If the stop is hit, the loss is about $99, close to the 1% target. The same maths works for other instruments once you use the right pip or point value.
Comparing Three Approaches on the Same Trade
| Approach | Stop distance | Position size | Money at risk |
| Fixed 1.00 lot | 30 pips | 1.00 lot | $300 (3.0%) |
| 1% fixed risk | 30 pips | 0.33 lots | $99 (about 1.0%) |
| 1% risk, volatility stop (1.5 x 50-pip ATR) | 75 pips | 0.13 lots | $97.50 (about 1.0%) |
The fixed 1.00 lot trade risks three times more than the others on an identical setup. In the volatility-based row, the wider 75-pip stop automatically reduces the size to 0.13 lots, so the money at risk stays near $100.
How Risk per Trade Shapes a Losing Streak
Take ten losing trades in a row. At 1% risk per trade, the account falls by about 9.6%. At 3% per trade, it falls by about 26.3%. Recovering a 26% loss needs roughly a 36% gain, while a 9.6% loss needs about 10.6%. Small, consistent risk keeps recovery realistic.
Managing Account Exposure Beyond a Single Trade
Good position sizing looks at the whole account, not one trade at a time.
Total Open Risk
Many systems cap the combined risk of all open trades, for example 5% of the account. With 1% per trade, that allows up to five trades at the same time.
Correlated Positions
Trades in closely related markets, such as EUR/USD and GBP/USD, can move together and behave like one larger position. Well-designed systems count correlated trades together, or reduce size when several are open.
Leverage and Margin Use
A system should keep margin usage comfortably below what the account allows. Staying well within margin gives the account room to handle normal price swings without forced closures.
Risk Limits Built Into Automated Systems
Position size is the first line of defence. Risk limits are the second.
Daily and Weekly Loss Limits
The system stops opening new trades after losing a set amount in a day or week, for example 3%, and resumes at the next session. This prevents one bad stretch from growing.
Maximum Drawdown Circuit Breakers
If the account falls a set percentage from its peak, such as 10%, the system pauses or reduces size until a review. It acts as a safety switch that does not depend on emotion.
Trade Count, Spread and Slippage Filters
Other controls include a maximum number of trades, a pause when spreads widen sharply, and limits around major news. These help keep execution consistent with the way the strategy was designed.
Why Disciplined Position Sizing Supports Better Execution
- Consistency. Every trade follows the same rule, so results reflect the strategy rather than mood.
- Capital protection. Defined risk per trade keeps losing streaks survivable.
- Easier measurement. When risk per trade is stable, you can judge performance and drawdown more clearly.
- Scalability. Percentage-based sizing grows with the account in a controlled way.
Common Position Sizing Mistakes to Avoid
- Using the same lot size regardless of stop distance
- Increasing size after losses to win the money back
- Ignoring correlation between open trades
- Risking too much per trade because the backtest looked strong
- Forgetting that pip values and contract sizes differ between instruments
How to Evaluate a System's Position Sizing
When reviewing any automated trading service, ask these questions:
- What percentage of the account is risked per trade, and is it fixed or variable?
- Does every trade have a stop-loss, and how is it set?
- Is there a cap on total open risk and on correlated trades?
- Are there daily loss limits and drawdown circuit breakers?
- Do the live results show a drawdown that matches the stated risk?
Frequently Asked Questions
Q1. What is automated trading position sizing?
It is the rule coded into an automated system that decides how large each trade should be, usually based on account size, risk per trade and stop-loss distance.
Q2. What is a sensible risk per trade?
Many traders use between 0.5% and 2% of the account, and lower for newer or more volatile strategies. The right level depends on your tolerance for drawdowns.
Q3. Is position sizing the same as leverage?
No. Leverage is the borrowing power your broker offers, while position sizing is how much of it you choose to use on each trade.
Q4. Does a smaller position size mean smaller profits?
Per trade, yes, but it also means smaller losses and a better chance of staying in the market through bad periods. Many traders find this trade-off worthwhile for steadier results.
Q5. Should I use the Kelly Criterion?
It is a useful idea but sensitive to inaccurate inputs. If used at all, most practitioners apply only a small fraction of the full Kelly figure. [3]
Final Thoughts: Sizing Is Where Discipline Becomes Practical
Position sizing turns risk management from an idea into a rule. By defining how much to risk per trade, capping total exposure and adding sensible limits, automated systems can keep execution disciplined and consistent. When you assess any trading service, a clear and well-explained sizing policy is one of the best signs of a thoughtful approach.
Sources and References
The numerical examples in this article are the authors’ own illustrations, not sourced statistics.
- [1] Wikipedia. Average true range (ATR introduced by J. Welles Wilder Jr., 1978). https://en.wikipedia.org/wiki/Average_true_range
- [2] Kelly, J. L., Jr.. A New Interpretation of Information Rate, Bell System Technical Journal, vol. 35, no. 4, July 1956, pp. 917–926. https://archive.org/details/bstj35-4-917
- [3] Wikipedia. Kelly criterion (fractional Kelly and sensitivity to estimation errors). https://en.wikipedia.org/wiki/Kelly_criterion
Want to See How Risk Shows Up in Real Results?
Learn how to check drawdown and equity curves yourself.
Read Our Guide to Verifying Live Trading Results →
Related Reading on AI Trading in the UAE
- How to Verify Live Trading Results: A Practical Guide
- AI Trading Software UAE: Buyer's Guide
- AI Trading Software Cost UAE: Hidden Fees Revealed
- How to Choose AI Trading Software: 10-Point Checklist
- Does AI Trading Software Really Work?
- Verified Live Software Performance
- Our Promise
Wealth-Builder Software© providing AI trading technology for investors across UAE, Saudi Arabia, and the GCC.

Related Posts



Comments (0)