
Is $10,000 enough for AI trading software? See a hypothetical account with fees, slippage, drawdown and loss scenarios, and what the minimum investment really means.
How to Verify Live Trading Results: A Practical Guide
If you are about to hand money to a trading service, signal provider or automated strategy, the single most useful skill you can learn is how to verify live trading results. Anyone can post a green chart or a screenshot with a big profit number. [1] Very few people can show results that stand up when you look at the raw data.
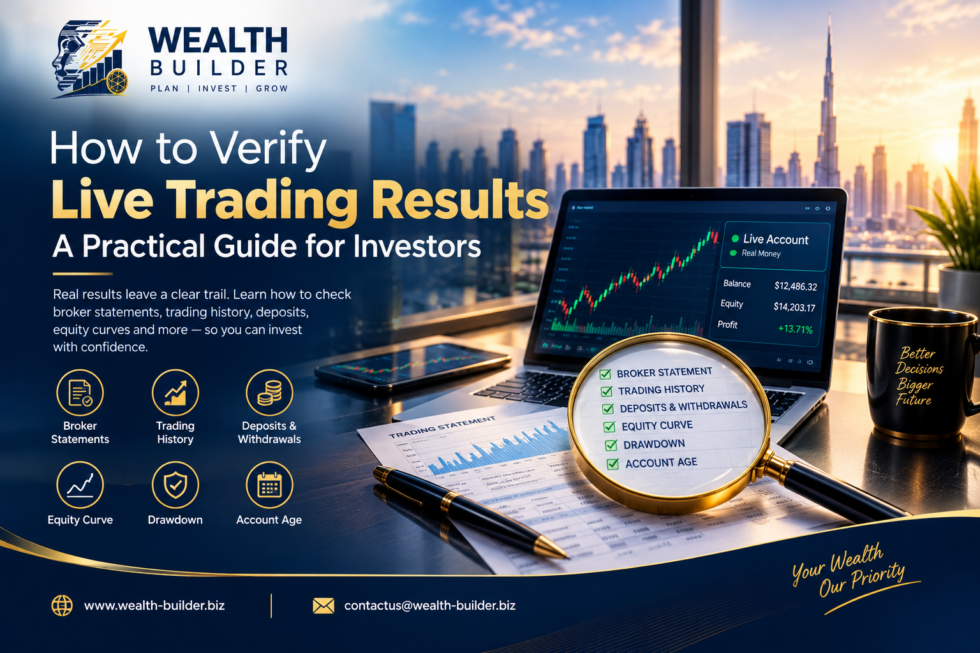
The good news is that real results leave a clear trail. Broker statements, full trading history, cash-flow records, equity curves, drawdown figures and account age all show what actually happened, and a provider with a genuine track record is happy to let you look at every one of them.
This guide shows you, step by step, how to check the evidence yourself with confidence. You will learn what to ask for, what to look at in broker statements and trading history, how to account for deposits, how to read an equity curve and drawdown, and why account age gives a track record its weight. No advanced finance knowledge is needed, just the right checklist, and verified live results make that checklist a pleasure to work through.
Disclaimer: This is educational content, not financial advice. Trading involves a high risk of loss, and verified past results do not guarantee future performance. Any figures used as examples are hypothetical and for illustration only.
Quick Answer: How Do You Verify Live Trading Results?
| Key Takeaways Start with the broker statement, or better, read-only investor access to the live account. A screenshot alone is not proof. Check the full trading history for completeness, then separate deposits and withdrawals from real trading profit. Read the equity curve and compare balance with equity, then check maximum drawdown against the return. Look for at least twelve months of continuous live trading on one account, and remember that verified past results never guarantee future returns. |
Why Verifying Live Trading Results Matters Before You Invest
Trading results are the main reason investors choose one provider over another, so it makes sense to look at them closely. Verification gives you three clear benefits.
- It confirms the results are live. Live accounts trade real money through a real broker, with real spreads, slippage and liquidity, so they show how a strategy performs in the real world.
- It shows the full picture of risk and reward. Return together with drawdown tells you how the gains were earned, and strong results with controlled drawdown stand out.
- It builds real confidence. When the underlying records match the headline numbers, you can invest knowing the track record is genuine.
Live Results vs. Backtests vs. Demo Accounts
A live account trades real money through a real broker. A demo account uses virtual money, and a backtest applies a strategy to historical prices. Only live results carry the costs and execution conditions you will face yourself, which is why they are the gold standard. A good provider states clearly which type of result they are showing.
Step 1: Check the Broker Statement
The broker statement is the foundation of verification, because it comes from the party that actually holds the account, not from the person promoting it.
What a Genuine Broker Statement Contains
- Account holder or account number, account currency and the broker's name
- The exact statement period, with start and end dates
- Opening and closing balance and equity
- A full list of closed trades, plus any open positions
- Deposits, withdrawals, credits, commissions and swap or financing charges
Ask for Read-Only (Investor) Access
The strongest proof is live, read-only access to the account. Most platforms, including MetaTrader 4 and 5, let the owner share an investor password that allows you to view trades and balances but not place trades or withdraw money. [2] Providers who are confident in their results are glad to offer this, and it is one of the strongest signs of a transparent track record.
Why Screenshots Alone Are Not Proof
A screenshot is a useful snapshot, but it shows only one moment in time. The best practice is to pair any screenshot with the full statement or live read-only access, so every number can be confirmed.
Confirm the Broker Itself Is Real and Regulated
A statement is most reassuring when it comes from a properly regulated broker. Check that the broker is licensed by a recognised regulator in its jurisdiction and look it up on the regulator's own public register, not through a link supplied by the provider. In the UAE, depending on the activity, relevant regulators include the SCA, the DFSA (for DIFC) and VARA (for virtual assets in Dubai). [3] [4] [5]
Step 2: Review the Full Trading History
Once the statement checks out, look at the trades themselves. A complete trading history tells you far more than a summary number.
Look for Completeness
The history should show every closed trade with its open time, close time, instrument, size, entry and exit price and profit or loss. Check that the trade numbering or timestamps run continuously. A complete, unbroken history is a strong sign that nothing has been left out.
Check Win Rate Against Risk and Reward
A good win rate is a positive sign, and it is even more convincing when it is backed by sensible risk management. Compare the average win with the average loss, and look at the largest single loss.
Watch for Risky Position-Sizing Habits
Strong strategies keep position sizes consistent and close losing trades according to clear rules rather than doubling down or holding them indefinitely. Consistent lot sizes and disciplined exits in the history are signs of healthy risk management.
Step 3: Separate Deposits and Withdrawals from Real Performance
Deposits and withdrawals do not change how a strategy performed, but they do change the account balance, so good verification always separates them from trading profit.
How Deposits Affect the Headline Return
Imagine an account that starts at $5,000 and ends the year at $9,000. That looks like an 80% gain. But if $3,000 of that was added through deposits, the real trading profit is only $1,000, or 20% on the starting balance. The best return figures account for cash flows, which is why clear, dated records make a track record easy to trust.
What Good Cash-Flow Records Look Like
- A clear, dated list of every deposit and withdrawal
- Trading profit shown separately from money added or taken out
- Credits or bonuses labelled clearly and kept apart from trading results
- Return percentages calculated on the capital actually at work
Ask for the return calculated on a time-weighted basis, or at least a clear, dated list of every deposit and withdrawal so you can check it yourself.
Step 4: Read the Equity Curve Carefully
The equity curve plots the account value over time. It is one of the most revealing charts in trading, because it shows how the money was made as well as how much.
Balance vs. Equity: Why the Difference Matters
Balance only changes when trades close. Equity also includes the floating profit or loss on open trades. When the balance and equity move closely together, it shows the strategy is managing its open trades well, without large floating losses building up in the background.
Signs of a Healthy Equity Curve
- Growth that is steady but not unnaturally perfect
- Pullbacks that are visible, modest and recovered over time
- Results that hold up across different months and market conditions
What Strong Consistency Looks Like
- Profit spread across many trades rather than one or two lucky wins
- Consistent position sizing from the first month to the latest
- Quick recovery after pullbacks, showing the strategy adapts to changing markets
Step 5: Understand Drawdown
Drawdown measures how far an account fell from a previous peak before it recovered. It is the best single measure of how much pain you might have to sit through to earn the returns being advertised.
Maximum Drawdown vs. Current Drawdown
Maximum drawdown is the largest peak-to-trough fall in the account's history. Current drawdown is how far below its peak the account sits right now. Ask for both, and make sure the maximum drawdown is measured on equity, not just closed-trade balance.
Why Big Drawdowns Are Harder to Recover From
Losses and recoveries are not symmetrical. A 10% loss needs about an 11% gain to recover. A 25% loss needs about 33%. A 50% loss needs a 100% gain just to get back to where you started. This is why a strategy that delivers solid returns with a small, well-controlled drawdown is so valuable: it protects your capital while it grows.
Compare Return to Drawdown
A simple check is to divide the annual return by the maximum drawdown. A strategy returning 30% with a 10% drawdown is in a very different risk class from one returning 30% with a 45% drawdown, even though the headline return is identical. The best providers share drawdown openly alongside returns, because low drawdown is something to be proud of.
Step 6: Consider the Account Age and Track Record Length
A longer track record carries far more weight than a short one. Markets change, and a strategy has to prove it can handle trending periods, sideways periods, high volatility and quiet spells.
How Long Is Long Enough?
There is no magic number, but as a practical guide, look for at least twelve months of continuous live trading, and ideally more. A longer record shows that the results come from a repeatable approach, not a short burst of luck.
Check That the Account Is the Same One Throughout
The most convincing track records come from one continuous account with a clear start date. Ask for the account's opening date and confirm that the history you are viewing covers its whole life.
Quick Reference: Live Trading Results Verification Checklist
Use this table as a fast summary when you review any provider's results.
| What to check | What good looks like | Ask for more detail if |
| Broker statement | Downloaded from the broker portal or a read-only link, with account number, dates and balances | Only a screenshot is available |
| Trading history | Every closed trade listed with open/close time, size, price and profit; no gaps | The history has gaps or starts only recently |
| Deposits and withdrawals | Clear list of money in and out, separated from trading profit | Cash-flow data is not provided |
| Equity curve | Smooth-enough growth that follows the balance and shows open-trade swings | Balance and equity move far apart |
| Drawdown | Maximum drawdown shown and in line with the strategy's stated risk | No drawdown figure is shared |
| Account age | Twelve months or more of live history across different market conditions | Only a few weeks of results exist |
What Genuine Transparency Looks Like
The best providers make verification easy. When you see these signs together, you can feel confident you are dealing with a transparent track record.
- Live results from a regulated broker. Real accounts with named brokers, dates and account details.
- Open access to the numbers. Full statements or read-only access, offered without hesitation.
- Honest, balanced reporting. Returns shown together with drawdown, currency amounts and the time period covered.
- Time to decide. No pressure, and a welcome for questions and checks before you invest.
- Realistic language. Clear explanations of risk and no promises of guaranteed profit. [6]
- Consistent history over time. A long, continuous record that holds up across different market conditions.
A Simple Step-by-Step Process You Can Follow Today
- Confirm the type of results: live, demo or backtest, with live being the gold standard.
- Request the broker statement for the full period, or read-only investor access.
- Verify the broker on the regulator's own public register. [4] [5]
- Go through the full trading history for completeness, consistent sizing and profit spread across many trades.
- Map every deposit and withdrawal and check the return on the capital actually at work.
- Study the equity curve and compare balance with equity.
- Check maximum drawdown and compare it to the return.
- Confirm the account age and that it is one continuous account.
- Start small and compare your own results with the verified record before committing more.
Frequently Asked Questions About Verifying Live Trading Results
Q1. How can I verify live trading results myself?
Ask for the broker's own statement or read-only investor access, check the full trading history, separate deposits and withdrawals from profit, then review the equity curve, drawdown and account age. When each of these is provided and matches the claimed results, you can treat the track record as properly verified.
Q2. Are third-party tracking sites reliable?
Independent tracking platforms that connect directly to the broker account are more reliable than a screenshot, because the data is pulled from the account itself. Still, check which broker the account is with and how long it has been connected, and use these sites as one source among several.
Q3. Is a high win rate a sign of a good strategy?
It is a good sign, and it is strongest when it comes with a healthy average win to average loss ratio and a low maximum drawdown. Together these show a well-balanced strategy.
Q4. What is a safe level of drawdown?
It depends on your own risk tolerance. The key is that the drawdown is clearly disclosed and that you would be able to sit through a fall of that size without panic-selling. Always ask what the worst drawdown was, not just the average one.
Q5. Can past live results guarantee future returns?
No. Verified live results are strong evidence that a track record is real, but they do not predict future performance. Markets change, and every strategy has periods of loss.
Sources and References
Regulator registers and platform features change, so always confirm the current position on the official pages.
- [1] U.S. Commodity Futures Trading Commission (CFTC). Customer Advisory: AI Won’t Turn Trading Bots into Money Machines. https://www.cftc.gov/LearnAndProtect/AdvisoriesAndArticles/AITradingBots.html
- [2] MetaQuotes. Managing Passwords – Accounts, MetaTrader 5 Help (investor password gives read-only access). https://www.metatrader5.com/en/mobile-trading/iphone/help/settings_accounts/account_passwords.md
- [3] UAE Securities and Commodities Authority (SCA) / VARA. SCA and VARA to ensure a unified register of regulated virtual asset service providers in the UAE, 18 July 2023. https://vara.ae/en/news/sca-vara-to-ensure-unified-va-sector-register-of-regulated-for-the-uae
- [4] DFSA (Dubai Financial Services Authority). Public Register: Firms. https://www.dfsa.ae/public-register/firms
- [5] VARA (Dubai Virtual Assets Regulatory Authority). Public Register of licensed VASPs. https://vara.ae/en/licenses-and-register/public-register
- [6] SEC Office of Investor Education and Advocacy, NASAA and FINRA. Artificial Intelligence (AI) and Investment Fraud: Investor Alert, 25 January 2024. https://www.investor.gov/introduction-investing/general-resources/news-alerts/alerts-bulletins/investor-alerts/artificial-intelligence-fraud
Want to See Verified Live Results Before You Commit?
Talk to the Wealth-Builder team about our live track record, the broker statements behind it and the risk framework we follow, so you can check every number yourself using the steps in this guide.
Related Reading on AI Trading in the UAE
- AI Trading Software UAE: Buyer's Guide
- AI Trading Software Cost UAE: Hidden Fees Revealed
- AI Trading Software Minimum Investment: Is $10,000 Enough?
- How to Choose AI Trading Software: 10-Point Checklist
- Does AI Trading Software Really Work?
- Verified Live Software Performance
- Our Promise
Wealth-Builder Software© providing AI trading technology for investors across UAE, Saudi Arabia, and the GCC.

Related Posts



Comments (0)