
Multi-asset cross hedging in automated trading explained: how correlations, hedge ratios and basis risk work, and where automated hedges can fail.
Unlock Hidden Market Profits with Powerful AI Trading
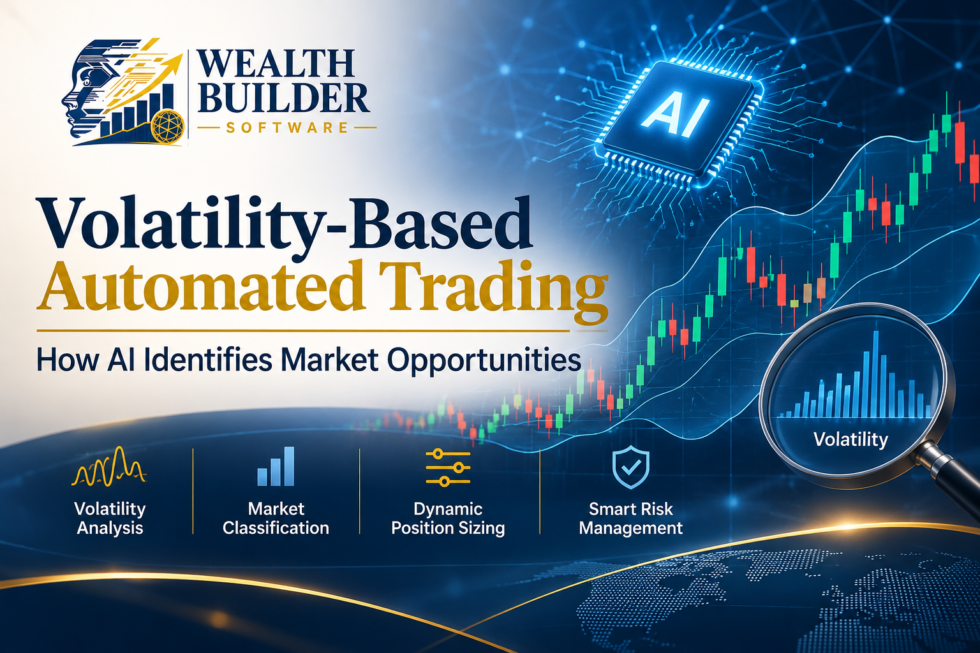
Volatility is how much and how fast a market's price moves. Volatility based automated trading uses software to measure those moves, decide when conditions look favourable and size positions to match. When AI is added, the system may also try to classify market conditions or adjust its rules as they change.
This guide explains how volatility is measured, how automated and AI systems use it, which strategies are common and where the risks lie. Trading, especially with leverage, carries a high risk of loss.
What Is Volatility in Trading?
Volatility describes the size of price swings. Higher volatility means larger and faster moves, which creates both more opportunity and more risk. It is not the same as direction: a market can be highly volatile while rising, falling or going nowhere.
Historical vs Expected Volatility
Historical volatility looks at how much prices actually moved over a past period, using tools such as standard deviation and Average True Range. Expected volatility is derived from option prices. The VIX is the best-known example: Cboe describes it as a reading of constant, 30-day expected volatility of the S&P 500 Index, expressed as an annualised, non-directional figure (Cboe). Cboe also says it does not offer insight into tomorrow's market movement.
How Volatility Is Measured
| Indicator | What it measures | Limits to remember |
| Standard deviation | How far prices typically move from their average | Looks backward and says nothing about direction |
| Average True Range (ATR) | The average price range over a set period | Needs other indicators to confirm signals |
| Bollinger Bands | Bands two standard deviations around a moving average | A trailing indicator, not foolproof |
| VIX | Expected 30-day volatility of the S&P 500, from option prices | US equity measure, not a forecast of tomorrow's move |
| Donchian and Keltner channels | Price channels that show ranges and possible breakouts | Can give false breakouts |
These descriptions follow IG's guide to volatility indicators, which also notes that none of them is necessarily best and that using them does not guarantee a positive outcome (IG).
How Volatility Based Automated Trading Works
Automated volatility analysis turns these measures into rules that a program can check on every price update.
- Measure: the system calculates volatility, for example ATR over a set number of periods.
- Classify: it labels the market as calm, normal or volatile, using preset thresholds.
- Decide: it applies a strategy that suits that condition, or stays out.
- Size: it sets position size and stop distance from current volatility.
- Execute and monitor: orders go to the broker and are managed by the rules.
Where AI Fits Into Volatility Based Automated Trading
AI volatility trading and AI market analysis claims vary widely, so it helps to separate what AI may do from what marketing implies.
What AI May Add
- Classifying market regimes, such as trending, ranging or high volatility.
- Combining several indicators into one signal instead of one rule.
- Adjusting parameters as conditions change, within set limits.
What AI Cannot Do
AI cannot predict markets reliably or remove risk. A model trained on past data can behave very differently in a new regime, and an adaptive system can also learn patterns that do not repeat. Ask any provider exactly what the AI does, how it was tested and for verified live results, not only backtests.
Common Strategies in Volatility Based Automated Trading
Breakout Strategies
IG notes that a Bollinger Band squeeze can be a precursor to a sharp rise in volatility, so some traders wait for price to break out. Its example uses a stop-loss above a prior high to limit risk (IG). False breakouts are a common weakness, so stops matter.
Volatility-Adjusted Position Sizing
Rather than trading the same size every time, the system shrinks positions when volatility rises and enlarges them when it falls, so the amount risked per trade stays similar.
Trading Volatility Itself
Some traders take positions on volatility directly, such as through the VIX. IG warns that shorting volatility is risky because there is potential for unlimited loss if volatility spikes, and that a long position also loses if no volatility occurs (IG). These are advanced products and unsuitable for most beginners.
Practical Example: Position Sizing in Volatility Based Automated Trading
This hypothetical example uses a $10,000 account that risks 1% ($100) per trade on EUR/USD, with the stop set at twice the ATR. It assumes a pip value of about $10 per standard lot and ignores costs and slippage. The figures are illustrative only.
| $10,000 account, risk 1% ($100), stop = 2 × ATR | Stop distance | Position size |
| Calm market (ATR 40 pips) | 80 pips | 0.125 lots |
| Volatile market (ATR 80 pips) | 160 pips | 0.0625 lots |
When volatility doubles, the stop doubles and the position halves, so the dollar risk stays at $100. A system that ignored volatility and used the same size and a fixed stop could take far larger losses in the volatile market, or be stopped out repeatedly by normal swings.
Risks of Volatility Based Automated Trading
- Sudden spikes: volatility can jump faster than a system adapts.
- Slippage and wider spreads: fills are often worse in fast markets.
- False signals: breakouts and indicators can fail, and they are largely backward-looking.
- Overfitting: rules tuned to past volatility may not work in new conditions.
- Leverage: IG warns CFDs carry a high risk of rapid loss, and that 80% of its retail CFD accounts lose money.
- Technology failure: outages and bad data can lead to wrong orders.
Risk Management Features to Look For
- Stops that scale with volatility, not fixed distances.
- Position sizes that fall when volatility rises.
- Maximum exposure and daily loss limits.
- A volatility filter that pauses trading during extreme conditions.
- Logs, alerts and a manual off switch.
- Verified live results across calm and stressed markets.
Frequently Asked Questions About Volatility Based Automated Trading
What is volatility based automated trading?
It is trading software that measures market volatility and uses it to time trades, set stops and size positions by preset rules.
How does AI analyse volatility?
AI may classify market conditions and combine several indicators, but it cannot predict markets reliably and still depends on its data and design.
Is high volatility good for trading?
It creates larger opportunities and larger risks. Losses can also be bigger and faster, especially with leverage.
What is the best volatility indicator?
No indicator is best. IG notes that none guarantees a positive outcome, and indicators work better when combined with other tools.
Does the VIX predict market crashes?
No. Cboe says it does not offer insight into tomorrow's market movement. It reflects expected volatility, not direction.
Final Thoughts
Volatility is useful information, but it is not a prediction. Volatility based automated trading works best as a risk tool first: it keeps position sizes and stops in line with how markets are actually behaving. Treat AI claims with caution, test across calm and stressed periods, and start small.
Sources

Related Posts

Comments (0)