
Multi-asset trading software dashboard showing gold, oil and stock index positions with exposure limits
Discover the Proven Support and Resistance Trading Algorithm for Winning Breakthroughs
Support and resistance are among the oldest ideas in technical analysis, and they translate naturally into code. A support and resistance trading algorithm scans price data, marks the levels where the market has repeatedly turned, and applies predefined rules to decide whether a setup is worth trading.
This guide explains how algorithms find those levels, how rules turn them into trade setups, why false breakouts are the biggest challenge, and what the limits are. Trading involves risk and you can lose some or all of your capital.
What Are Support and Resistance Levels?
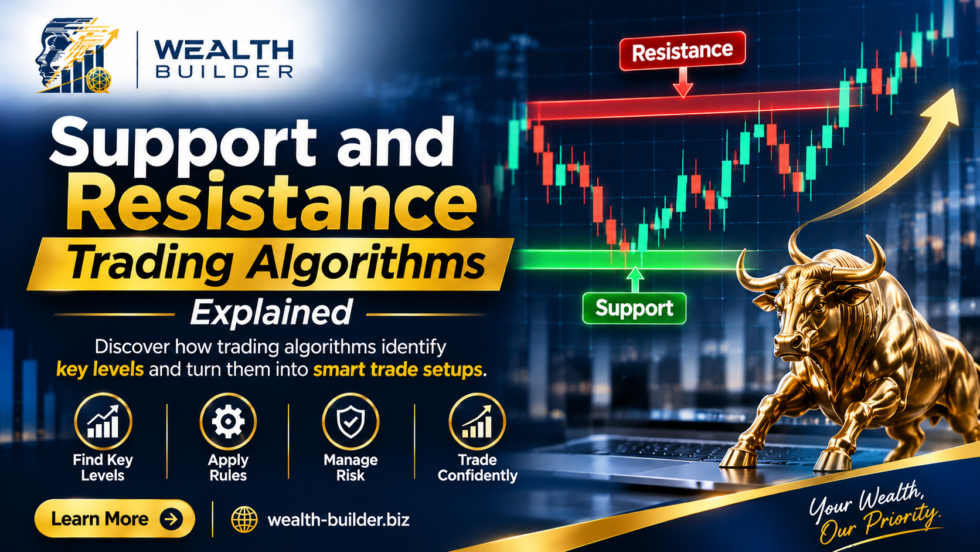
IG defines support and resistance as price levels that appear to limit a market's movement. Support is where falling prices regularly stop and bounce, and resistance is where rising prices regularly stall and turn back. IG attributes these levels to supply and demand (IG).
Two points matter for software. First, IG says major levels are better thought of as zones than exact prices, so an algorithm should work with ranges, not single numbers. Second, past patterns may not repeat, so a level is a probability, not a promise.
How a Support and Resistance Trading Algorithm Finds Levels
Software cannot look at a chart the way a person does, so it uses measurable rules. The table shows the common approaches.
| Method | How the algorithm uses it | Type of level |
| Swing highs and lows | Finds recent peaks and troughs in price data | Horizontal |
| Price clustering | Groups swing points that sit close together into a zone | Horizontal zone |
| Higher-timeframe levels | Imports levels from 1-hour or 4-hour charts onto a shorter chart | Horizontal |
| Moving averages | Treats an average as a moving level | Dynamic |
| Pivot points | Calculates levels from the previous session's high, low and close | Calculated |
| Fibonacci retracements | Marks ratio-based levels between a swing high and low | Calculated |
Swing Highs and Lows
The simplest method looks for a price that is higher (or lower) than a set number of bars on each side of it. Each such point is a candidate level.
Grouping Points Into Zones
Candidate points that sit within a small distance of each other are merged into one zone, for example within 10 pips. The zone is then described by a top, a bottom and a number of touches.
Dynamic and Calculated Levels
IG notes that moving averages, trendlines and indicators can produce dynamic levels that move as the chart progresses. It also describes pivot points as levels based on the previous session's high, low and close (IG). Software can calculate these instantly for many markets.
Scoring Strength
According to IG, a level that price touches more often is considered more reliable, and levels many traders watch can become self-reinforcing. An algorithm can turn this into a score, such as the number of touches, how recent they are and how large the reactions were.
Predefined Rules: Turning Levels Into Setups
A level alone is not a trade. The algorithm applies rules written in advance, which usually fall into two families.
Bounce (Range) Setups
The software looks to buy near support or sell near resistance when price is moving sideways. IG notes that traders typically wait for confirmation that the trend is still intact and place stops beyond the level, with targets and acceptable losses set before entering.
Breakout Setups
The software waits for price to move beyond a level. IG describes a breakout as sudden, rapid movement with increased momentum, not a slight move past the level (IG).
Filters That Reduce Bad Trades
- News filter: pause before major scheduled releases.
- Spread filter: skip trades when spreads are unusually wide.
- Volatility filter: require a minimum or maximum range.
- Time filter: avoid illiquid hours.
False Breakouts: The Biggest Challenge
IG defines a false breakout as a failed breakout: price moves beyond a level but does not sustain the move and reverts. A bull trap breaks above resistance and drops back, while a bear trap breaks below support and rallies (IG).
How Algorithms Try to Avoid Them
- Wait for a close: IG suggests waiting for the candle to close to confirm strength.
- Use several timeframes: to put the move in context.
- Check momentum and volume: IG says breaks with strong momentum and high volume are more often genuine. Some markets, such as forex, have no single volume figure, so software may use tick volume or candle size as a stand-in.
- Require a buffer: the close must be a set distance beyond the level.
The Trade-Off
IG notes that extra confirmation can reduce false breakouts but may also cause you to miss the opportunity. Stricter rules mean fewer false signals and also fewer good trades.
Risk Management Rules Built Into a Support and Resistance Trading Algorithm
- Stop-loss placement: beyond the level, so the trade is closed if the level fails.
- Position size: based on the distance to the stop, risking a small fixed share of the account.
- Take-profit: set before entry, often as a multiple of the risk.
- Trade limits: a cap on trades per level, per day and in total open risk.
Practical Example: A Support and Resistance Trading Algorithm on EUR/USD
This hypothetical example shows a simple breakout rule set. All values are assumptions for illustration.
| Rule | Setting in this hypothetical example |
| Level detection | Swing highs on the 1-hour chart over the last 200 bars, grouped into a zone if within 10 pips |
| Minimum touches | At least 3 touches before the zone counts as resistance |
| Breakout signal | A candle closes at least 5 pips above the top of the zone, with a range larger than average |
| Entry | At the open of the next candle |
| Stop-loss | 15 pips from entry, back inside the zone |
| Take-profit | 30 pips (twice the risk) |
| Position size | 1% of the account at risk per trade |
| Filters | Skip trades before major news, when spreads are wide, or if the level already traded today |
Suppose the algorithm finds a resistance zone with a top at 1.1005. When a candle closes above 1.1010 with a large range, it enters at about 1.1012, sets a stop at 1.0997 (15 pips) and a target at 1.1042 (30 pips). On a $10,000 account risking 1% ($100), the position is about 0.67 lot, or $6.67 per pip.
| Outcome on a $10,000 account | Pips | Result (about 0.67 lot, $6.67 per pip) |
| Breakout holds, target hit | +30 | +$200 before costs |
| False breakout, stop hit | −15 | −$100 before costs |
| False breakout with 3 pips of slippage | −18 | −$120 before costs |
What the Example Shows
With a target twice the size of the stop, the strategy breaks even before costs if about one in three trades wins. Out of 10 trades, 4 winners and 6 losers would give 4 × $200 minus 6 × $100, a gain of $200. With only 3 winners and 7 losers, the result is a $100 loss. Spreads, slippage and financing push that break-even point higher, so real results are worse than these before-cost figures.
Limits and Risks of a Support and Resistance Trading Algorithm
- Overfitting: settings such as zone width, touches and buffer can be tuned until a backtest looks perfect. Researchers have shown that the more variations you test, the more likely a result is overfit (Bailey et al., 2014).
- Levels are not exact: IG notes that levels are better treated as zones, and different markets are driven by different factors.
- Repeated signals: IG warns that using several indicators that measure the same thing can create false confidence.
- No guarantees: IG says indicator predictions are based on probability, with no guarantees.
- Leverage and costs: frequent trades add trading costs, and leverage can magnify losses.
How to Evaluate a Support and Resistance Trading Algorithm
- Ask how levels are detected and how wide a zone is allowed to be.
- Ask what confirms a breakout and how false breakouts are handled.
- Ask for the risk rules: stop placement, position size and trade limits.
- Request live broker statements, not only backtests.
- Check the results after spreads, slippage and fees.
- Test on a demo account before using real money.
Frequently Asked Questions About a Support and Resistance Trading Algorithm
Q1: What is a support and resistance trading algorithm?
It is software that detects support and resistance levels in price data and applies predefined rules to decide when to enter, exit and size trades.
Q2: How does an algorithm identify support and resistance?
Usually by finding swing highs and lows, grouping nearby points into zones and scoring them by touches. It may also use moving averages, pivot points or Fibonacci levels.
Q3: What is a false breakout?
A move beyond a support or resistance level that fails to hold and reverses. Waiting for a candle close and checking momentum can reduce the risk but not remove it.
Q4: Can a support and resistance algorithm guarantee profit?
No. Levels are zones, markets change, and costs and slippage reduce results. Any provider promising guaranteed returns should be treated with caution.
Q5: Should I trust a backtest of this kind of strategy?
Treat it as a starting point only. Settings can be overfit, so ask for live broker statements and test on a demo account.
Final Thoughts
A support and resistance trading algorithm is a set of rules for finding zones where price has reacted, waiting for a defined condition and then managing risk. It brings consistency, but not certainty. Ask how levels are detected, how false breakouts are handled and what live results show, and never risk more than you can afford to lose.
Want to See How Rule-Based Strategies Are Built and Tested?
Book a consultation with the Wealth Builder team to walk through how rules, filters and risk controls work before you commit capital.
Sources

Related Posts



Comments (0)